Tuesday 26 April 2022

NG13 - Translate your Angular app with ngx-translate

How to translate your Angular app with ngx-translate:

-----------------------------------------------------------------

Overview steps - 1-6 levels

Add ngx-translate to your Angular application

Setup the TranslateService in your app.module.ts

Create your main language translation file (json)

Use translation markup (translate pipe) in your template files

Translate your json files to other languages

Switch languages at runtime

Extract translations form your source code


npm install -g @angular/cli


ng new translation-demo


cd translation-demo

ng serve


Step 1: Add ngx-translate your Angular application

npm install @ngx-translate/core @ngx-translate/http-loader

The @ngx-translate/core contains the core routines for the translation: The TranslateService, the translate pipe and more.

The @ngx-translate/http-loader loads the translation files dynamically from your webserver.


Step 2: Set up the TranslateModule and TranslateService

Now you have to init the translation TranslateModule in your app.module.ts. The required changes to that file are highlighted in blue:


import { NgModule } from '@angular/core';

import { BrowserModule } from '@angular/platform-browser';

import { AppComponent } from './app.component';

// import ngx-translate and the http loader

import {TranslateLoader, TranslateModule} from '@ngx-translate/core';

import {TranslateHttpLoader} from '@ngx-translate/http-loader';

import {HttpClient, HttpClientModule} from '@angular/common/http';


@NgModule({

    declarations: [

        AppComponent

    ],

    imports: [

        BrowserModule,


        // ngx-translate and the loader module

        HttpClientModule,

        TranslateModule.forRoot({

            loader: {

                provide: TranslateLoader,

                useFactory: HttpLoaderFactory,

                deps: [HttpClient]

            }

        })

    ],

    providers: [],

    bootstrap: [AppComponent]

})

export class AppModule { }


// required for AOT compilation

export function HttpLoaderFactory(http: HttpClient): TranslateHttpLoader {

    return new TranslateHttpLoader(http);

}


import { Component, VERSION } from '@angular/core';

import { TranslateService } from '@ngx-translate/core';

@Component({

  selector: 'my-app',

  templateUrl: './app.component.html',

  styleUrls: ['./app.component.css'],

})

export class AppComponent {

  name = 'Angular ' + VERSION.major;

  constructor(private translate: TranslateService) {

    translate.addLangs(['en', 'de']);   // in the initial level not required, 

    translate.setDefaultLang('en');

    translate.use('en');

  }


  useLanguage(language: string): void {

    console.log(language);

    this.translate.use(language);

  }

}


Step 3: Create your JSON translation file

Each language is stored in a separate .json file. Let's create the JSON file for the English translation: 

assets/i18n/en.json . Use the texts from the app.components.html .


ngx-translate can read 2 JSON formats:


assets/i18n/en.json

{

    "demo": {

        "title": "Translation demo",

        "text": "This is a simple demonstration app for ngx-translate"

    }

}


assets/i18n/de.json

{

  "demo": {

    "title": "Translation demo - from en json",

    "text": "This is a simple demonstration app for ngx-translate - from en json",

    "greeting": "Hello {{name}}!"

  }

}


app.component.html:


<hello name="{{ name }}"></hello>

<p>Start editing to see some magic happen :)</p>


<button (click)="useLanguage('en')">en</button>

<button (click)="useLanguage('de')">de</button>


<div>

  <h1>Translation demo</h1>

  <p>This is a simple demonstration app for ngx-translate</p>

</div>


<h1>{{ 'demo.title' | translate }}</h1>


<!-- translation: translation pipe -->

<p>{{ 'demo.text' | translate }}</p>


<!-- translation: directive (key as attribute)-->

<p [translate]="'demo.text'"></p>


<!-- translation: directive (key as content of element) -->

<p translate>demo.text</p>


hello.component.ts:


import { Component, Input } from '@angular/core';


@Component({

  selector: 'hello',

  template: `<h1>Hello {{name}}!</h1>

  <p>this pare is from child component</p>

  <p translate>demo.text</p>`,

  styles: [`h1 { font-family: Lato; }`],

})

export class HelloComponent {

  @Input() name: string;

}


ref:

https://www.codeandweb.com/babeledit/tutorials/how-to-translate-your-angular-app-with-ngx-translate#add-ngx-translate-to-app


https://stackblitz.com/edit/angular-ivy-zywaay?file=src%2Fapp%2Fapp.component.html

Sunday 10 April 2022

Web App metrics in UI Architect Stand point - Security, Performance, Offline PWA, Accessibility, Early loading-PRPL, SSR

External Validation, coding less

--------------------------------------

1.Security: OWASP , SQL injection, XSS, XSRF,  

2.Performance Testing: light house Web page test- chrome extension to validate 

    1.First Contentful Paint 2.Time to Interactive 3.Speed Index 4.Total Blocking Time 5.Largest Contentful Paint 6.Cumulative Layout Shift
  • Performance – time to interactive, latency, speed index, resources optimization, TTFB, asset delivery, scripts execution time, DOM size, etc.
  • SEO – Mobile friendly, meta, crawling, canonical, structure, etc.
  • Best Practices – Image optimization, JS libraries, browser error logging, accessible over HTTPS, known JS vulnerabilities, etc
  • Accessibility  – Page elements, language, ARIA attributes, etc.
  • PWA (Progressive Web Application) – redirect HTTP to HTTPS, response code ok, fast loading on 3G, splash screen, viewport, etc.

UI Code / developer involvement

-------------------------- --------------

3.PWA: provide unexpected offline support for app to surve and store in local instead of broken

4.Accessibility :Aria-label=" text to hover explain" - button, link, video, 

                        Screen reader - extension/ plugin

5.Early loading-PRPL - semi page load (on scroll down make another) or html,css load then load the app data values

<link rel="preload" as="style" href="css/style.css"> Lazy load

  • Push (or preload) critical resources.
  • Render the initial route as soon as possible.
  • Pre-cache remaining assets.
  • Lazy load other routes and non-critical assets
  • 5.SSR - Server side rendering.

Angular 13- Ngx-swimlane Charts

 Create a new angular application using the following command 

ng new ngx-charts-demo


Install ngx-charts package in an angular application using the following command.

npm install @swimlane/ngx-charts --save


At the time of installation if you get the following error

ERROR in The target entry-point "@swimlane/ngx-charts" has missing dependencies:

 - @angular/cdk/portal

we need to add @angular/cdk using the following

npm install @angular/cdk --save


Import NgxChartsModule from 'ngx-charts' in AppModule.  -- only in App module, not in the feature module

ngx-charts also required the BrowserAnimationsModule. Import it in AppModule.


import { BrowserModule } from '@angular/platform-browser';

import { NgModule } from '@angular/core';

import { AppComponent } from './app.component';

import { NgxChartsModule }from '@swimlane/ngx-charts';

import { BrowserAnimationsModule } from '@angular/platform-browser/animations';

@NgModule({

  declarations: [

    AppComponent

  ],

  imports: [

    BrowserModule,

    BrowserAnimationsModule,

    NgxChartsModule

  ],

  providers: [],

  bootstrap: [AppComponent]

})

export class AppModule { }


import { Component } from '@angular/core';

@Component({

  selector: 'app-root',

  templateUrl: './app.component.html',

  styleUrls: ['./app.component.css']

})

export class AppComponent {

  saleData = [

    { name: "Mobiles", value: 105000 },

    { name: "Laptop", value: 55000 },

    { name: "AC", value: 15000 },

    { name: "Headset", value: 150000 },

    { name: "Fridge", value: 20000 }

  ];

}


<ngx-charts-pie-chart 

    [results]="saleData"

    [legend]="true"

    [legendTitle]="'Product Sale Report'" 

    [view]="[1000,300]"

    [labels]="true" >

</ngx-charts-pie-chart>


<!--<ngx-charts-bar-vertical 

    [view]="[1000,400]"

    [results]="saleData"

    [xAxisLabel]="'Products'"

    [legendTitle]="'Product Sale Chart'"

    [yAxisLabel]="'Sale'"

    [legend]="true"

    [showXAxisLabel]="true"

    [showYAxisLabel]="true"

    [xAxis]="true"

    [yAxis]="true"

    [gradient]="true">

</ngx-charts-bar-vertical>-->


<!--<ngx-charts-pie-chart 

    [results]="saleData"

    [legend]="true"

    [legendTitle]="'Product Sale Report'" 

    [view]="[1000,300]"

    [labels]="true" >

</ngx-charts-pie-chart>-->


<ngx-charts-advanced-pie-chart 

      [view]="[1000,400]"

      [results]="saleData"

      [gradient]="true" >

</ngx-charts-advanced-pie-chart>


Angular 13 - Highchart

 npm install highcharts --save

npm install highcharts-angular --save


add high chart as component and def at declarations


import { HighchartsChartModule } from 'highcharts-angular'; 


@NgModule({

   declarations: [

      AppComponent,


   ],

   imports: [

      BrowserModule,

  commonModule,

  HighchartsChartModule

   ],

   providers: [],

   bootstrap: [AppComponent]

})

export class AppModule { }


<highcharts-chart

   [Highcharts] = "highcharts" 

   [options] = "chartOptions" 

   style = "width: 100%; height: 400px; display: block;">

</highcharts-chart>


import * as Highcharts from 'highcharts';

@Component({

  selector: 'app-highchart',

  templateUrl: './highchart.component.html',

  styleUrls: ['./highchart.component.less']

})

export class HighchartComponent implements OnInit {


  constructor() { }


  ngOnInit(): void {

  }


highcharts = Highcharts;


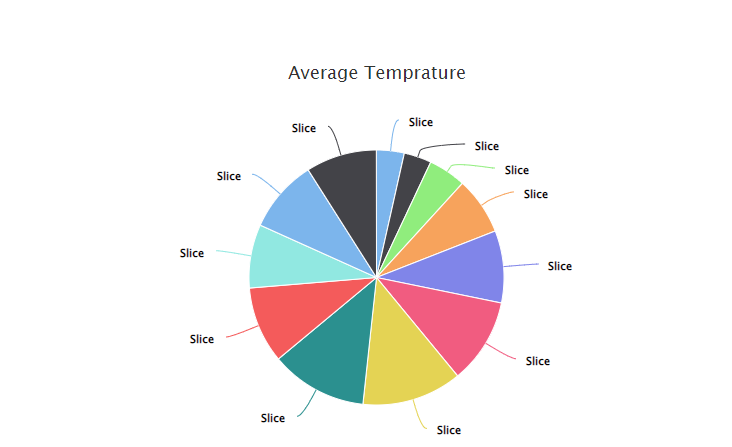
  chartOptions: Highcharts.Options = {

    title: {

      text: 'Average Temprature',

    },

    xAxis: {

      title: {

        text: 'Tokyo',

      },

      categories: [

        'Jan',

        'Feb',

        'Mar',

        'Apr',

        'May',

        'Jun',

        'Jul',

        'Aug',

        'Sep',

        'Oct',

        'Nov',

        'Dec',

      ],

    },

    yAxis: {

      title: {

        text: 'Temprature',

      },

    },

    series: [

      {

        data: [

          7.0, 6.9, 9.5, 14.5, 18.2, 21.5, 25.2, 24.4, 19.3, 16.0, 18.4, 17.9,

        ],

        type: 'spline',     // type:'bar', type:'pie' , type: 'spline',   

      },

    ],

  };

}


Angular 13 - d3.js

 npm install d3 --save

npm install @types/d3 --save-dev


import * as d3 from 'd3';


<div #svgContainer (window:resize)="onResize()"></div>


import {  AfterViewInit,  Component,  ElementRef,  HostListener,  Input,  OnChanges,  SimpleChanges,  ViewChild} from '@angular/core';

import * as d3 from 'd3';

import {ScaleBand} from 'd3';


@Component({

  selector: 'app-d3chart',

  templateUrl: './d3chart.component.html',

  styleUrls: ['./d3chart.component.less']

})

export class D3chartComponent implements AfterViewInit, OnChanges {


  @Input() data;//!: { name: string, series: { name: string, value: number }[] }[];

  @Input() height = 300;

  @Input() margin = {top: 10, left: 50, right: 10, bottom: 20};

  @Input() innerPadding = 0.1;

  @Input() outerPadding = 0.1;

  @Input() seriesInnerPadding = 0.1;

  domain = [0, 1000];

  @Input() barColors = ['#00aeef', '#f98e2b', '#7C77AD'];

  //  @Input() domain = [0, 1000];

  //  @Input() barColors = ['#00aeef', '#f98e2b', '#7C77AD'];

  //  @Input() data!: { name: string, series: { name: string, value: number }[] }[];


  public svg!: d3.Selection<SVGGElement, unknown, null, undefined>;


  public isRendered = false;


  @ViewChild('svgContainer', {read: ElementRef, static: true}) svgContainerRef!: ElementRef<HTMLDivElement>;


  constructor() {

      this.barColors = ['#a9ce97', '#a5b5de'];

      this.domain = [100, 1000];

      this.data = [

      {

        name: 'Row1',

        series: [

          {name: 'Bar1', value: 150},

          {name: 'Bar2', value: 200}

        ],

      },

      {

        name: 'Row2',

        series: [

          {name: 'Bar1', value: 300},

          {name: 'Bar2', value: 400}

        ],

      },

      {

        name: 'Row3',

        series: [

          {name: 'Bar1', value: 500},

          {name: 'Bar2', value: 1000}

        ],

      }

    ];

  }


  @HostListener('window:resize')

  onResize() {

    this.createChart();

  }


  ngOnChanges(changes: SimpleChanges) {

    if (this.isRendered) {

      this.createChart();

    }

  }


  ngAfterViewInit(): void {

    this.createChart();

    this.isRendered = true;

  }


  private createSVG(): void {

    this.svg = d3.select(this.svgContainerRef.nativeElement)

      .append('svg')

      .attr('width', '100%')

      .attr('height', this.height)

      .append('g')

      .attr('width', '100%')

      .attr('transform', 'translate(0, 0)')

      .attr('class', 'bar-chart-vertical');   /// chart type 

  }


  private isDataValid(): boolean {

    return this.data && this.data.length > 0;

  }


  private getBandScale(domain: string[], range: any, innerPadding = 0, outerPadding = 0) {

    const scale: any | ScaleBand<string> = d3.scaleBand()

      .range(range)

      .domain(domain)

      .paddingInner(innerPadding)

      .paddingOuter(outerPadding);

    scale.type = 'BAND';

    return scale;

  }


  private createChart(): void {

    if (!this.isRendered) {

      this.createSVG();

    }

    if (this.isDataValid()) {

      const margin = {

        top: this.margin.top,

        right: this.margin.right,

        bottom: this.margin.bottom,

        left: this.margin.left,

      }


      let height = this.height - margin.top - margin.bottom;

      const width = this.svgContainerRef.nativeElement.getBoundingClientRect().width - margin.left - margin.right;

      const groupNames = this.data.map(item => item.name);

      const groupLabels = this.data.length > 0 ? this.data[0].series.map(item => item.name) : [];


      const xScale = this.getBandScale(groupNames, [0, width], this.innerPadding, this.outerPadding).round(true);

      const x1Scale = this.getBandScale(groupLabels, [0, xScale.bandwidth()], this.seriesInnerPadding, this.outerPadding).round(true);


      let chartContainer = this.svg.selectAll<SVGGElement, number>('g.chart-container').data([1]);

      chartContainer = chartContainer.enter()

        .append('g')

        .attr('class', 'chart-container')

        .merge(chartContainer)

        .attr('transform', `translate(${margin.left}, ${margin.right})`);


      let chartWrap = chartContainer.selectAll<SVGGElement, number>('g.chart-wrap').data([1]);

      chartWrap = chartWrap.enter()

        .append('g')

        .attr('class', 'chart-wrap')

        .merge(chartWrap)

        .attr('transform', 'translate(0, 0)');


      const xAxis = chartWrap.selectAll<SVGGElement, number>('g.x-axis').data([1]);

      xAxis.enter()

        .append('g')

        .attr('class', 'x-axis')

        .merge(xAxis)

        .attr('transform', `translate(0, ${height})`)

        .call(d3.axisBottom(xScale)).selectAll('text')

        .style('text-anchor', 'middle');


      const y = d3.scaleLinear().domain(this.domain).nice().rangeRound([height, 0]);


      let barWrap = chartWrap.selectAll<SVGGElement, number>('g.bar-wrap').data([1]);

      barWrap.exit().remove();

      barWrap = barWrap.enter().append('g')

        .attr('class', 'bar-wrap')

        .merge(barWrap);


      let barGroup = barWrap.selectAll<SVGGElement, {name: string, series: {name: string, value: number}}>('g.bar-group').data(this.data);

      barGroup.exit().remove();

      barGroup = barGroup.enter().append('g')

        .attr('class', 'bar-group')

        .merge(barGroup)

        .attr('transform', d => `translate(${xScale(d.name)}, 0)`);


      let barRects = barGroup.selectAll<SVGRectElement, {name: string, value: number}>('rect.bar').data(d => d.series.map(item => item));

      barRects.enter()

        .append('rect')

        .merge(barRects)

        .attr('class', 'bar')

        .attr('width', x1Scale.bandwidth())

        .attr('height', d => height - y(d.value))

        .attr('x', (d: any) => x1Scale(d.name))

        .attr('y', d => y(d.value))

        .attr('fill', (d, i) => this.barColors[i]);


      let yAxis = chartWrap.selectAll<SVGGElement, number>('g.y-axis').data([1]);

      yAxis.enter()

        .append('g')

        .attr('class', 'y-axis')

        .merge(yAxis)

        .call(d3.axisLeft(y));

    }

  }

}


Tuesday 5 April 2022

addEventListerner for window.onload in Javascript

 <!DOCTYPE html>

<html lang="en">

<head>

<metadata tag="UTF-8">

<script>

window.onload = function()

{

let test = document.getElementById("body");

test.addEventListener("mouseout", function(event) {

  // highlight the mouseenter target

  console.log('mouse out'); 

})

}

</script>

</head>


<body id="body">

Online Test mouse out to count for mouse out from screen to prevent user interaction with google

</body>

</html>


Friday 1 April 2022

Http API Base url set up in React and Angular

 React:

Soln:1

=======
api.js
import axios from "axios";
const api = axios.create({
 baseURL: process.env.REACT_APP_BASE_URL || "http://localhost:3000",
});

export default api;

import api from "../services/api";
const response = await api.post("/sessions", { email, password });

Soln:2
=======
import Axios from "axios";

Axios.defaults.baseURL = "http://127.0.0.1:8000/api/";

in any other components use

insted of http://127.0.0.1:8000/api/user use only user

axios.get('user')  // just 'user' append the data
.then((res)=> {
console.log(res)
})

Angular:
-----
environment.ts

export const environment = {
production: false,
baseUrl: 'http://fakerestapi.azurewebsites.net/api'
};
environment.prod.ts file
export const environment = {
production: true,
baseUrl: 'https://jsonplaceholder.typicode.com'
}

refer baseUrl from environment.ts file 

import { environment } from '../environments/environment';
@Injectable()
export class DataService {
baseUrl = environment.baseUrl;
constructor(private httpClient: HttpClient) { }
getUser(id: number) {
let url = this.baseUrl + '/users/1';
return this.httpClient.get<JSON>(url);
}
}